How do you know if your nonprofit’s website is underperforming, and how can you find ways to improve it?
Your nonprofit’s website plays a key part in raising support and awareness for your cause, and in driving donations. Websites are also becoming much more important as more people move to digital communication.
There are several ways you can measure how much your website is supporting your overall goals.
Each website analytic metric can be seen as part of a puzzle. Together, these performance indicators will give you a clearer picture of where your website is working, and where it may need improvement.
While there are many metrics out there, the most important ones measure three categories for nonprofit success: Awareness, Engagement, and Growth of Support Base and Donations.
Awareness
The first step for any nonprofit organization is to raise awareness, both of the problems you are trying to solve and your solutions.
Traffic
The number of visitors that view your website, often measured by number of individual users or by sessions.
- User – a unique visitor to your website
- Session – a single visit to your website, including visits to multiple pages on the same site
Measuring traffic is the most basic way to understand your nonprofit website’s success level.
While traffic is not the only metric for success, in general, the more site visitors you get, the more people are aware of your nonprofit and its cause.
Traffic also provides a great broad picture of whether your marketing strategies are working.
Measure traffic to make sure that your efforts to raise awareness through marketing are actually successful in bringing more visitors to your website.
How much traffic does your website need to be successful?
There is no target traffic number that nonprofits should hit in order to grow their organization.
Generally, more traffic than you have had in the past means more awareness and more growth.
While there is no specific target number, it may be helpful to compare your nonprofit’s website traffic to those of other nonprofit organizations of a similar size, location, or structure.
Traffic may fluctuate seasonally as well, so you should measure site traffic on a long term, year to year basis, rather than month to month. This long term strategy will paint a better picture of growth overall.
While traffic is a helpful broad-strokes indicator of growth, traffic should not be your standalone goal.
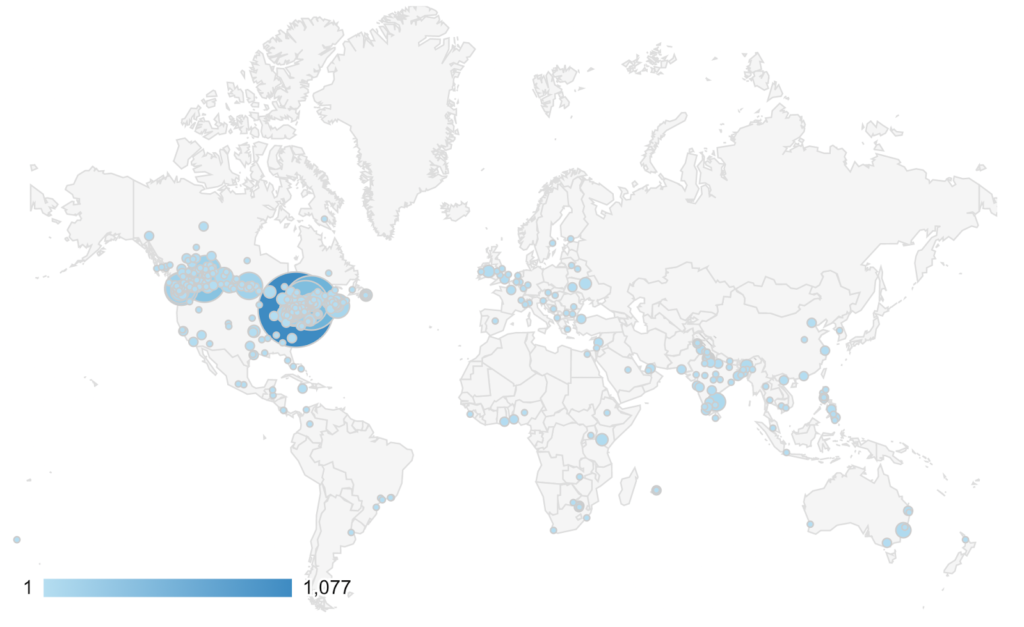
It is important to also take into consideration which pages users are viewing, which channels visitors are coming from, as well the physical location your traffic is coming from.
For example, if you are a locally-based organization, it may be important that your visitors are located in your area.
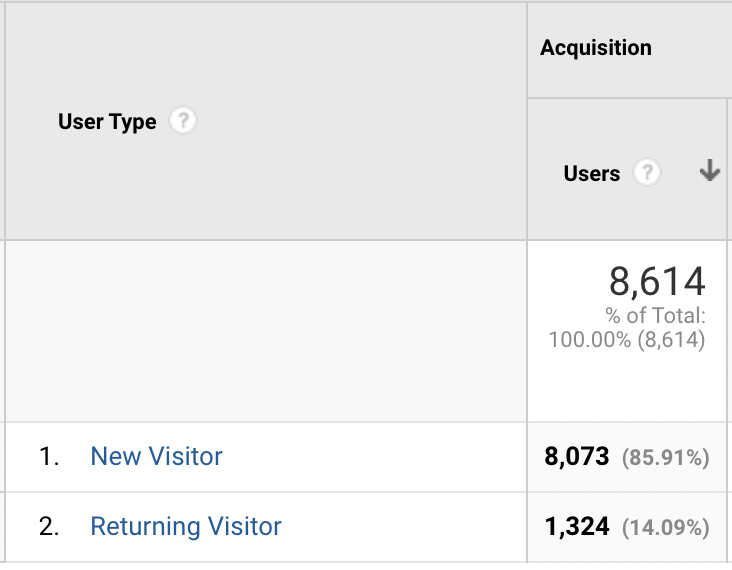
Additionally, it may be helpful to analyze whether your visitors are first-time visitors or are returning. All of this can be evaluated within Google Analytics.
How can you increase traffic to your nonprofit’s website?
The number of visitors to your website may be less important than who those visitors are.
Tailor your marketing efforts to attract the visitors that are important to your nonprofit.
Focus on bringing more visitors who may answer your call to action, whether that is joining a newsletter, signing a petition, or donating.
Efforts to increase traffic and awareness may include:
- Search engine optimization
- Use of the $10k Google Ad Grant
- Social media marketing
- Publishing educational content via your blog
- Paid media like Google Ads, Facebook Ads, etc.
Engagement
Engagement is how we quantify our website performance in providing the right information to our site visitors… simply put: are potential supporters getting the information they are searching for on our site? Or, are they leaving to find it elsewhere?
There are several ways to measure engagement which will help you understand how successful your website is in communicating with potential supporters.
Bounce Rate
The percentage of visitors to your website that leave after only looking at a single page.
Bounce rate is a simple measure of how well your website engages its visitors. Are people interested in learning more about your cause after visiting their first page?
Your goal is to have visitors read a single page, which will lead them to explore more pages on your website. For example, perhaps an overview page about one of your issues leads to an educational page that provides more specifics on that issue.
If visitors are leaving after only looking at one page, this may indicate that your website’s content needs some work. If your website is confusing or dull, visitors are less likely to visit other pages, and ultimately, are less likely to support your nonprofit’s growth.
What should your nonprofit website’s bounce rate be?
You know your goal should be a lower bounce rate. But what does this mean?
Many nonprofits have a bounce rate around 60%, while the general average for websites is closer to 40%.
While in general a lower bounce rate means higher engagement, there is no golden bounce rate that you should be aiming for.
If you have a page or multiple pages that you suspect are underperforming and have a bounce rate of 70% or higher, it’s worth investigating. You may be able to find an issue with that page that is preventing your site visitors from finding the information they need.
It is equally important not to rely too heavily on bounce rate as a single metric of engagement, as a low bounce rate doesn’t always tell the whole story.
If visitors are having trouble finding the right page, they may visit many pages before deciding the website is too confusing, and leaving. While this may lead to a low bounce rate, this is not the type of engagement that will lead to your nonprofit’s success.
How can you lower your site’s bounce rate?
In order to get visitors to stop “bouncing” off your website so quickly, you first need to analyze why people may not be getting what they want from the site.
Here are some questions you can ask to make sure your website is working for you and for its visitors:
- Is your website very slow to load?
- Does the formatting make it difficult to understand the main purpose of the page?
- Is there too much information presented in a single page or in single paragraphs?
- Is there too little information?
- Are your optimized keywords relevant to the page?
- Do your pages link to other related pages in a simple and clear way?
Once a visitor gets frustrated, whether by a slow loading time or getting overwhelmed by information, they are likely to leave the website — and you lose a potential supporter.
Lower your bounce rate by making sure that website visitors can not only easily find information, but also that your site is organized and easy to navigate.
Pages per Session
The number of pages on your website that a visitor views on a single visit to the website (session)
Pages per session provides more insight beyond a simple bounce rate into how visitors are engaging with your site. This is a good metric to use in combination with bounce rate to get an idea of how your pages are performing.
Pages per session can indicate how easy your website is to navigate, and how helpful or interesting visitors find your content.
What does a successful nonprofit website’s pages per session look like?
Generally a higher pages per session means that visitors are engaged with your content and are interested in learning more about your cause (especially if they are going to pages that indicate they want to support you: Donate, Subscribe for Updates, Volunteer).
Pages per session is a great way to measure interest level in your nonprofit and its issues. Visitors who visit multiple pages are more likely to support your cause.
Pages per session will also tell you how people navigate your site. You can use the behavior user flow reports to follow how visitors are interacting with the website.
You can also view Page Exits to see if you’re losing a high number of visitors on particular pages. This would indicate a user experience problem on those pages.
Many nonprofit organizations aim for 2 pages per session, but this varies based on your website setup and your goals.
Like other website analytic metrics, don’t depend too heavily on pages per session as the sole indicator of your website’s success.
Although more pages per session is generally a good thing, visitors who are lost or confused may click through to many pages in a single session if they are unable to find what they are looking for.
How do you increase pages per session on your nonprofit’s website?
Like any of these performance indicators, one of the best ways to increase pages per session is to know your target audience.
If you know what visitors are looking for, you can make sure that your website is set up to support their learning and exploration.
Your site should be easy to navigate. The easier it is to navigate, the better chance you have that users will stick around.
Map the journey that you want your nonprofit’s website users to take. Tell your users where to go next after they have read a page. This may take the form of hyperlinks within your text, a “read next” section, or a call to action button or form.
It also goes without saying that your website content should be engaging, informative, and if appropriate, interactive.
Average Session Duration
The average amount of time that a user spends on your website.
Average session duration tells you how long visitors spend on your nonprofit’s website.
Generally, a higher session duration shows a visitor is more engaged with your website and is more likely to support your nonprofit’s goals.
This is an important metric to consider in addition to bounce rate and pages per session, as it paints a more detailed picture of how users are engaging with your website.
Perhaps your pages per session is low, but the session duration is fairly high. This may mean that users are engaging with your content more than the pages per session implies.
What is a good average session duration?
Unlike other metrics that are more of a double-edged sword, a “good” average session duration is pretty straightforward: the longer the better.
In general, a good average session duration is around 2-3 minutes.
While this may seem quite short, it is usually enough time for visitors to engage with your content.
Use average session duration in combination with other engagement metrics to understand how users are engaging with your content, and for how long.
Average session duration is most helpful when looking specifically at traffic sources and segmented views (who your visitors are, eg. returning or new visitors).
How do you increase the average session duration on your nonprofit’s website?
The answer to this question is similar to the other engagement metrics: make your website easy to navigate and make your content engaging.
A great example of easy navigation is keeping your website organized by topics and subtopics.
Direct visitors who read a more general page on an issue to subtopics on this issue. The option to read related content that you already know they are interested in will keep visitors on your page longer.
This organization also shows visitors that your nonprofit is an expert on the issues, and has a deep understanding of the problems and potential solutions.
For example, your nonprofit may have a landing page about environmental problems related to water. Within this section, you may also have pages related to specific issues, such as drought, contamination, and water accessibility.
Evaluating engagement is all about understanding what information your website visitors are looking for and helping them get it. Providing quality information and making it easy to access builds trust.
If you are able to build trust with website visitors, they are more likely to support your cause.
Growth of Support Base and Donations
We use goals and conversions to measure how successful we are in turning site visitors into active supporters.
Goals and Conversions
Goal completions: the completion of expected or desired actions on your website.
Conversion rate: the percentage of people that complete the desired outcome or action.
The final metric that is crucial to measuring your website’s success is goals and conversions.
These measure the people or percent of people who take your call to action and actually complete it. This metric tells you how successful your website and marketing is in convincing people to take action.
This could be signing up for a newsletter, signing a petition, or donating, among other things.
Completion of these calls to action are crucial for growing your support base. A wide support base and steady donations are what allows many nonprofits to truly succeed in achieving their goals.
What should your conversion rate goal be?
The average nonprofit’s conversion rate is around 1%. This may be higher or lower depending on your goal and your specific call to action.
Even small increases of your conversion rate over time make a big impact on your support base and can change the trajectory of your organization’s growth.
By increasing your conversion rate to even 1.5%, you’ll effectively increase your donations (or support base, depending on what your goal is) by 50%.
How can you increase your conversion rate and meet your nonprofit’s conversion goals?
Meet your visitors where they are.
This means that you should make it easy for people who are ready to donate to do so.
Not everyone who visits your website will be ready to take action, though. Make it easy for people who are still in the learning stage to get more information, which will eventually lead them to a more substantial ask (donate or join mailing list)..
Don’t be afraid to ask when the time is right. Make sure you have a strong and clear call to action. This may be a form embedded on your website or a clear button that leads supporters to a donation page.
People especially like to know the impact of their donation. Let supporters know how their money or time is going to help your nonprofit reach its goals.
Lastly. your donation or signup page should be simple and easily manageable. If you ask for too much information or the page is slow to load, people may abandon the task before it is complete.
What metric should you focus on to improve the growth of your nonprofit?
If you’ve read this far, you should not be surprised by the following advice: Do not depend on any single metric to analyze your nonprofit’s website success.
That said, all of these website analytics metrics can be overwhelming at first. Start by focusing on traffic. After all, you need people to actually visit your site before any of the other metrics come into play.
After you’re getting traffic, then you can focus on the engagement metrics. Make sure people are reading and understanding your site with ease and enjoyment.
Finally, after you improve your engagement, you can focus on the conversion metrics.
Make sure to keep your nonprofit’s goals in mind when analyzing any one of these performance indicators.
Need Help Growing Awareness and Building Trust?
Ask us.
We’ve analyzed and helped thousands of websites improve how they reach the right people and build relationships with them.
Comment below with questions
OR
Ask us a question privately: